Medical Engineering
Bubbles in Ultrasound Reveal Tiny Vessels
A touch of the button is all it takes to improve the resolution of ultrasound images fivefold. This is down to bubbles floating in the bloodstream and a clever algorithm.
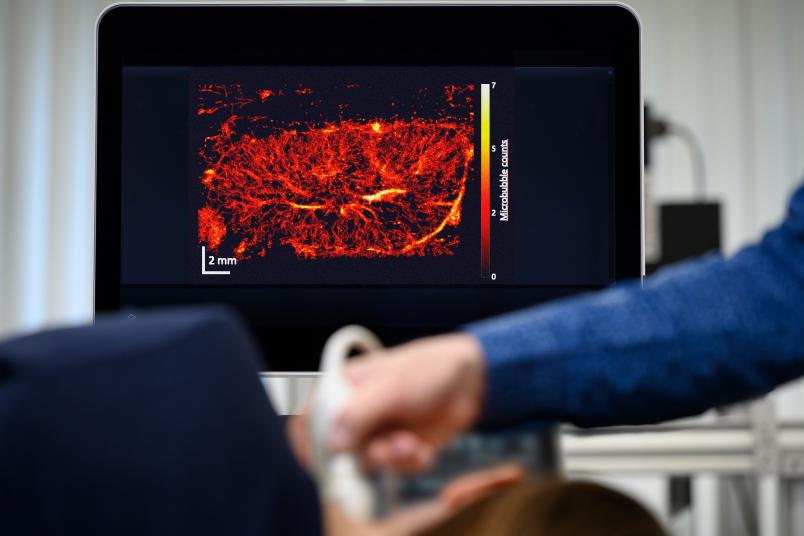
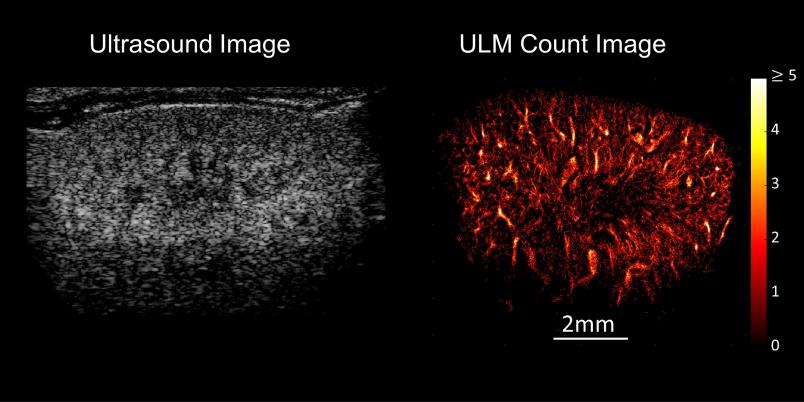
A grey-white composition of shapes and textures – this is what an ultrasound image looks like to the layperson. But it reveals much more to the trained eyes of a doctor. They might be able to tell that the ultrasound image presented by Professor Georg Schmitz is that of a mouse kidney. But even for them, the image doesn’t show more than a rough structure. The resolution is too low for anything more than that. Georg Schmitz has an ace up his sleeve, however: Suddenly, white dots stream into the image and cut their way through the kidney structure. A few moments later, a sharp, vivid image emerges, displaying the vascular system of the kidney in full color.
Schmitz and his team from the Chair of Medical Engineering at Ruhr University Bochum have been refining this technique, so-called ultrasound localization microscopy (ULM), for over ten years. In 2011, they came up with the brilliant idea of using a contrast agent consisting of microbubbles for the high-resolution imaging of vessels in ultrasound. Gas vesicles of contrast medium, which have been in clinical use since 2000, are only about one micrometer in size and are coated with phospholipids. When administered into the vein, they follow the flow of blood into the smallest vessels and reflect ultrasound waves so effectively that they light up white in the image. “The contrast agent only remains in the body for around ten minutes, then the bubbles are broken down and the gas is exhaled through the lungs,” explains Georg Schmitz. It only takes 30 to 90 seconds to take the images.
Marking the center of each microbubble
Still, in order to increase the resolution of an ultrasound image as dramatically as in the image of the mouse kidney, it’s necessary to perform several intermediate steps. The first is also one of the most challenging: The involuntary movements of the patient’s body must be taken into account. Heartbeat and breathing make the examined organs pulsate in all directions. If this movement were not factored in, it would distort the vascular image. This is particularly difficult for movements in the third direction, which is perpendicular to the image plane. “We’re still in the process of optimizing our algorithm for this,” says Georg Schmitz.
In the next step, the algorithm developed by the researchers at the Faculty of Electrical Engineering and Information Technology removes the background from the images so that only the microbubbles are displayed. They move along with the blood, approach each other and overlap. This means that their image alone doesn’t provide any added value for the visualization of the smallest blood vessels. The next step is therefore to mark the center of each individual bubble. “This is a relatively simple process, which can be based, for example, on an evaluation of the brightness and the shape of a vesicle,” outlines Georg Schmitz, whose team has already won prizes at conferences with this method.
Which path did the bubble follow?
The next step is once again more difficult: Reconstructing the movement of the individual bubbles from the sequence of images. “The image refresh rate for ultrasound devices in clinical use is around 10 to 50 Hertz,” says Schmitz. “This means that the device records between 10 and 50 individual images per second.” Each of these images shows the microbubbles in motion at different locations. The challenge lies in calculating which bubble has traveled along which path – in other words, finding out exactly where the same bubble is in one image and the next. “Our algorithm always looks at a group of neighboring images and uses the highest probability to decide which path a bubble has taken,” explains Georg Schmitz. “You can never achieve 100% accuracy in a reasonable computing time – but you don’t have to.”

What ultimately emerges from the entire calculation after a few minutes is an image of the system of small vessels through which the bubbles have moved. It’s even possible to read off the direction and speed in which the bubbles have streamed through.
Measuring resp. predicting therapeutic success
“The direction of movement and the shape of the small vessels through which the blood flows are information that physicians need to know precisely,” stresses Georg Schmitz, who has worked with clinical partners on several projects. “This is because it allows them to identify the characteristics of a tumor, for example: Where is it supplied from? What do the supplying blood vessels look like?” Such information can provide insight into how aggressive a disease is and possibly also which therapy will or will not work. Looking at the smallest vessels is also valuable for monitoring the effect of chemotherapy. “Chemotherapeutic agents often target blood vessels,” explains Schmitz. “In the course of treatment, ultrasound localization microscopy often reveals that more vessels are visible than before, presumably because the pressure in the tumour decreases as a result of the therapy and vessels open up. In the progress of a successful treatment, we then observe how the supplying vessels gradually disappear.”
Ultrasound localization microscopy is currently the only clinical imaging method that can make such fine blood vessels visible. “Computed tomography only shows vessels by using toxic contrast agents, and, as with magnetic resonance imaging, the resolution is much lower,” says Schmitz. The difficulty in using ULM lies in the fact that the transducer is operated freehand and therefore orientation is more difficult than with MRI, which always shows a complete cross-section of the body part.
The quality of the images is so good that medical device manufacturers have expressed their interest in the technology. In any case, there are plenty of ideas on how to deploy it: ULM can, for example, be used to precisely examine whether metastases have formed in lymph nodes, as the vascular system adapts in the process. Current diagnostics are wrong in up to 30 percent of cases. ULM could also enable non-invasive monitoring of kidney function, for example to find out whether an acute kidney disease is at risk of becoming chronic or not. “The relevant processes take place in tiny vessel networks of around 200 micrometers in diameter, which simply couldn’t be imaged until now,” explains Georg Schmitz. ULM is about to do just that.


