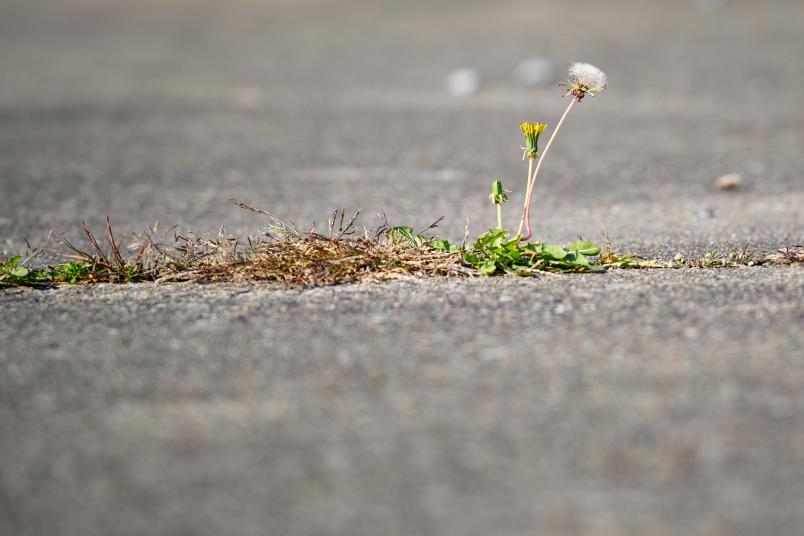
Where the ground is impervious like this, water can hardly seep away.
Geoscience
Where Surfaces Are Impervious
Many areas in North Rhine-Westphalia are paved over by impervious surfaces such as roads, housing estates and industrial sites. While this is obvious from aerial photographs, it is difficult to analyze.
It was an image that went around the world: the European Football Championship round of sixteen between Germany and Denmark, brought to a sudden halt by a violent summer thunderstorm. Torrents of rain pelt down from a black wall of clouds, cascading from the stadium roof onto the stands like a waterfall. While Danish fans cheerfully take a shower, stewards try to control the water with mops and shovel it into a gully. This example shows on a small scale what has become a serious problem in many cities: the increasing number of impervious surfaces. Where the ground is paved over with roadways and buildings, water can’t seep into the ground, as we witnessed in the stands of the Dortmund stadium. As a result, roads can become torrential rivers during heavy rainfall.
In order to tackle this problem, the German government has decided to limit the amount of impervious surfaces as part of the German Sustainable Development Strategy. Between 2017 and 2020, approximately 54 hectares of open space were claimed every day across Germany for the construction of new transportation routes and residential areas. The aim is to reduce this figure to less than 30 hectares per day by 2030. North Rhine-Westphalia too is called upon to do its part. But how much land is currently paved over in Germany’s most densely populated federal state? And how can we continuously record the amount of impervious surfaces? A team from the Department of Geosciences at Ruhr University Bochum has the answers.
Artificial intelligence detects impervious surfaces
Funded by the North Rhine-Westphalia Office of Nature, Environment and Consumer Protection and under the direction of Professor Andreas Rienow, Jan-Philipp Langenkamp has developed a model that uses artificial intelligence (AI) to identify impervious surfaces in aerial photographs.

To date, the amount of impervious surfaces in NRW has been determined using the land survey registers of the 53 land registry authorities. These registers record which areas are used and how. However, not all impervious surfaces are included: “Smaller buildings such as garden sheds, for example, which don’t require planning permission, are not recorded,” points out Andreas Rienow. Such supposedly small deviations from reality do add up. To determine the percentage of impervious surfaces based on the register, authorities assume, for example, that 50 percent of residential areas and traffic infrastructure are impervious. “This method provides a good estimate, but no more than that,” says Rienow.

In some cases, is is not so easy to decide which areas should be considered impervious.
In the project “Capturing the impervious surface area throughout North Rhine-Westphalia to determine the soil sealing indicator” (EBOVE), the Bochum-based researchers from the Interdisciplinary Geographic Information Science working group at the Institute of Geography are developing a more precise method. In the first step, they defined which areas should be considered impervious and which should not. The crucial factor was whether rainwater can seep into the surface. “In some cases, this is not so easy to decide,” as Andreas Rienow illustrates: “If someone builds a swimming pool in their private garden, the pool will capture rainwater, but the ground underneath is still impervious.” Bridges over rivers, underground structures such as subways, parking garages and basements, as well as photovoltaic systems on open fields were also shaky candidates. “In case of doubt, we used the aerial images to decide whether such areas should be considered impervious,” explains Rienow. What looked impervious in the image was considered impervious for the purpose of the study.

Every model is only as good as the data that was used to train it.
For his doctoral thesis, Jan-Philipp Langenkamp made use of open-source AI models, which he adapted and trained for his research in Bochum. “Every model is only as good as the data that was used to train it,” he says, describing a particularly time-consuming part of the research project. The Bochum group trained their algorithm with thousands of sections from aerial photographs taken across North Rhine-Westphalia; for these, geography students had previously defined which structures represented impervious surfaces and which did not. Such data was already available for some areas, provided for example by the city of Wuppertal and the Emschergenossenschaft water board. But this material wasn’t enough. In order to obtain sufficiently reliable training data, the Bochum-based group invested around 1,000 working hours in classifying images by hand, in order to teach the AI model to distinguish between impervious and pervious areas.
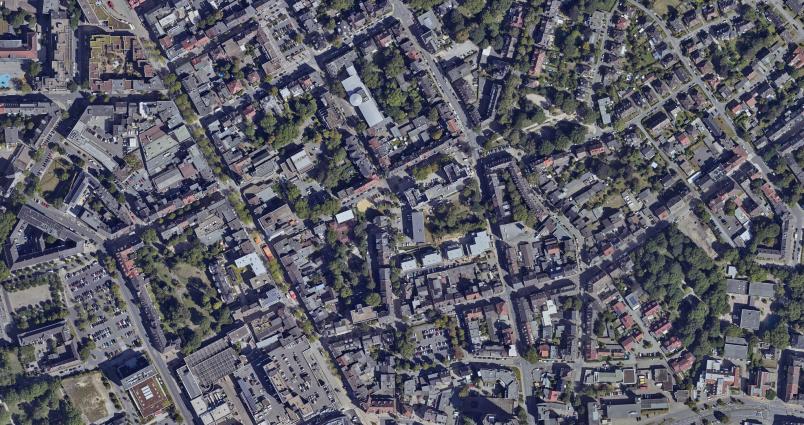
Unlike previous projects, Rienow’s EBOVE team uses georeferenced aerial photographs. These photographs are taken annually during flights over North Rhine-Westphalia and are available in public databases. “In previous projects, we used satellite data, but its resolution is lower,” explains Andreas Rienow. While one pixel of a Sentinel-2 satellite image covers an area of ten by ten meters, one pixel of an aerial image represents an area of ten by ten centimeters. In the aerial image, therefore, a smaller area is squeezed into a single pixel, meaning that information on impervious surfaces can be determined more precisely.
North Rhine-Westphalia represented by 35,000 image tiles
The whole of North Rhine-Westphalia is represented in the dataset by 35,000 image tiles, each one square kilometer in size. In order to evaluate these data volumes in a reasonable amount of time, the analyses are carried out by the Statistical Office of North Rhine-Westphalia (IT.NRW). Even with the high-performance computers available there, analysis takes around three days.
The dataset presents another challenge: “The flights that produce the images take place in spring and summer, so we have tiles from different seasons in one dataset,” explains Langenkamp. A tree without leaves is more difficult to recognize as a green area in spring than in summer. “On the other hand, when the trees are bare, it’s easier to see whether a road is still visible between the branches,” adds Andreas Rienow. Having data from different seasons can therefore be an advantage. “However, we have to make sure that we map all of these cases in our training data so that the AI knows how to deal with them later during classification,” says Langenkamp.
Model delivers approximately 90 percent accuracy
The key factor in the Bochum researchers’ methodology is that the model not only evaluates the information of each individual image pixel, but also takes the context into account. “For example, buildings often have a road run next to them – and our algorithm is aware of this fact,” explains Jan-Philipp Langenkamp. The AI model now achieves area-by-area accuracies of approximately 90 percent; this means that it correctly classifies roughly 90 percent of the pixels as impervious or pervious.

The idea is that users without specific prior knowledge can also run the analysis.
Jan-Philipp Langenkamp has also designed the software so that it can be started at the touch of a button and automatically processes publicly available geodata from the state of North Rhine-Westphalia. “The idea is that users without specific prior knowledge can also run the analysis so that it can be repeated every two years with new datasets,” he explains.
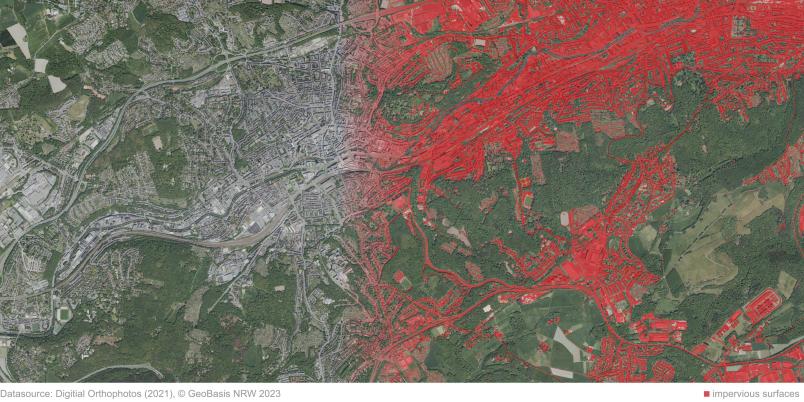
Once the process is complete, the results are available as a binary mask that can be superimposed on the aerial image and shows whether the respective surface is impervious or not. This includes the grounds where the stands of the Dortmund stadium are located.
