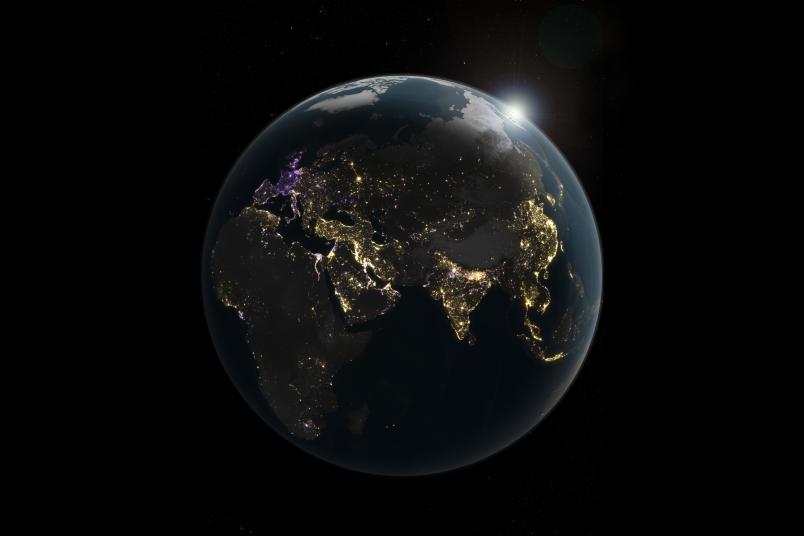
The final accumulated nighttime light change area: A night-time view of Earth, capturing human activity across the eastern hemisphere of the planet through the emissions of artificial light. Derived from satellite images taken daily over the past decade, the image maps the dynamics of the human night-time activity, with golden areas experiencing brightening, purple areas featuring dimming, and white areas experiencing both.
Geography
Satellites capture the glowing pulse of human civilization
The COVID-19 lockdowns and energy-saving measures resulting from the war in Ukraine have clearly dimmed the lights across much of Europe. This is shown by a new analysis of satellite data.
Viewed from a great distance in both space and time, the nighttime glow of inhabited areas on Earth is steadily increasing. However, the hidden variability within in this overall change has been demonstrated by a new analysis of satellite data undertaken by a research team from the University of Connecticut, in collaboration with NASA and researchers in the U.S. and Germany. “For the first time, daily satellite images were used for this purpose on a global scale,” says Professor Christopher Kyba, professor of nighttime light remote sensing at the Ruhr University Bochum, Germany, who participated in the study. The data confirm earlier studies that light emissions are increasing overall. However, the most important new finding is that fluctuations occur frequently, and are not solely attributable to major factors such as the COVID-19 lockdowns or the war in Ukraine. The researchers reported their findings in the April 8, 2026, issue of the journal Nature.
An analysis of data from the VIIRS DNB satellite instrument covering the years 2014 to 2022 finds that nighttime lighting is increasing globally by about two percent per year. “Although there has been a total increase of 16 percent worldwide, that does not mean that lighting is increasing everywhere,” explained Christopher Kyba. “In areas where lighting increased, we found global emissions rose by 34 percent. This was offset by an 18 percent decrease in emissions from other areas.” These local changes in lighting were much more dynamic than previously assumed. While China and India became increasingly brighter due to urbanization during the analysis period, measured emissions from other industrialized nations tended to decrease, for example because they switched to LED lighting or introduced regulations to curb light pollution.
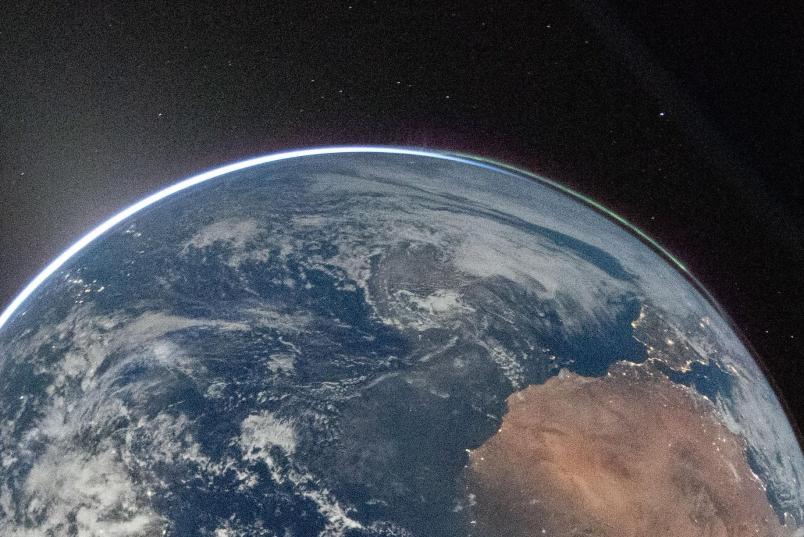
And here’s another, very fresh view from high above: NASA astronaut and Artemis II Commander Reid Wiseman took this picture of Earth from the Orion spacecraft’s window.
A dramatic decline in lighting was observed in Ukraine following the Russian invasion. France also dimmed significantly at night (down 33 percent), as many municipalities there turn off streetlights after midnight to save energy and reduce light pollution. “In Germany, light emissions remained almost constant overall despite local variations,” Kyba reports. “While light emissions rose by 8.9 percent in brightening German regions, they fell by 9.2 percent in dimming areas.” Overall, nighttime light emissions observed by the satellite in Europe declined by four percent—though this small decrease may not reflect the human experience, as there are differences between the sensitivity of this satellite instrument compared to human vision.
First global analysis at full resolution
These findings were made possible by analyzing data from each individual night. Previous observations were based on monthly or annual composites, which due to instrumental factors made it more difficult to detect and measure changes. “Until now, no global analysis had been conducted using the full-resolution nighttime data,” Kyba emphasizes. The researchers also made use of an algorithm that incorporates information about the satellite’s viewing angle into account. For example, residential areas usually appear brighter when viewed from an angle than when viewed from directly above, but the opposite is usually the case in city centers. The new analysis accounts for such differences for the first time.
The Satellite
A new satellite for Europe
“Artificial light is a major consumer of electricity at night, and light pollution harms ecosystems,” says Christopher Kyba. “It is therefore important to understand how both of these are changing.” Kyba is leading a team that is proposing a state-of-the-art satellite for observing night lights to be selected for the European Space Agency’s (ESA) “Earth Explorer 13” mission. This new satellite would be able to see much fainter lights than existing satellites and, thanks to its high resolution, would greatly reduce the current uncertainty about exactly what is changing. “While the U.S. and China each have multiple satellites that observe nighttime light, there is currently no European satellite designed for this purpose,” says Kyba.